Research to Action

The Global Guide to Research Impact

Navigation

  • Home

  • How To ▾

    This list of how to’s provides an essential guide for a number of key communication and engagement activities that will help make your research travel.

    • Building Capacity
    • Policy Briefs
    • Research Impact
    • Theory of Change
    • Uptake Strategy
  • Topics ▾

    • AEN Evidence 23
    • Eye on 2022
    • Impact Practitioners
    • Knowing your audience ▸
      • Building a strategy
      • Engaging policy audiences ▸
        • EBPDN
        • Targeting policy actors
        • Targeting practitioners
      • Stakeholder mapping
      • Strategic communication ▸
        • Building a brand
        • Engaging the public
      • Working with the media
    • Making your research accessible ▸
      • Framing challenges
      • Knowledge translation
      • Learning in context
      • Open access
      • Presenting your research
      • Using digital tools ▸
        • Using multi media
        • Using online tools/ICTs
        • Using social media
      • Using intermediaries
    • Monitoring and evaluation ▸
      • Applying M&E methods
      • Evidence into policy
      • Measuring success
    • Uncategorized
  • Dialogue Spaces ▾

    • Youth Inclusion and Engagement Space
    • AEN Evidence
    • GDN: Doing Research
    • Manchester Policy Week 2015
    • TTI Exchange 2015
    • Strengthening Institutions to Improve Public Expenditure Accountability (GDN PEM Project)
    • DFID/AusAid Research Communication and Uptake Workshop
    • 3ie Policy Influence and Monitoring (PIM) project
    • Policy Engagement and Communications (PEC) Programme
  • Reading Lists

  • Impact Practitioners

    • Impact Practitioners overview
    • Capacity Building
    • Communication and Engagement
    • Frameworks
    • Indicators
    • Learning
    • Monitoring and Evaluation
    • Policy Impact
    • Strategy
    • Theoretical
    • Utilisation

Social Media

  • Facebook
  • Twitter
  • Instagram
  • LinkedIn
  • Vimeo

Featured

Sparkwise: Ten reasons why you should set one up!

By Betty Paton 04/12/2013

You have created an online presence with your research, you communicate regularly and engage frequently, you’ve built up a following on social media platforms and generate good traffic to your website…All fantastic stuff, but how do you report this back to your stakeholders or keep track of your online metrics?

Each platform has it’s own way of recording your impact (Facebook Insights, Google Analytics…) and it can be labourious switching between them building up statistical reports that track what you do online. Sparkwise is an online tool that allows you to create interactive and dynamic dashboards to display all of your website and social media statistics and metrics…in one place and for free!

“Tell me more!’ I hear you cry…

By following simple steps you can link your Google Analytics, Facebook, Twitter, Flickr, YouTube, Vimeo, Picasa and other bespoke platforms and feed them into one central place to give you all the metrics you need in one glance.

Tomorrow Partners, funded and directed by Gaby Brink, designed Sparkwise as an application specifically for non-profit organisations to feedback statistics from, and generate interest in, their campaigns. In it’s early stages, the design was tested by groups funded by the Bill and Melinda Gates Foundation – also one of the funders alongside the John D. and Catherine T. MacArthur Foundation, the Ford Foundation, the Wyncote Foundation, and the Fledgling Fund.

Creating an account with Sparkwise allows you to put together your own smörgåsbord of multimedia-based data and statistical panels using a series of easily manipulated widgets that are incredibly intuitive and straightforward to create. I have created a live Sparkwise dashboard for Research to Action (R2A) (see a static screengrab below). This dashboard can be accessed through the R2A site and is made up of metrics assembled using Google Analytics, Facebook, Twitter, Flickr and Vimeo in order to show R2A’s reach and engagement.

“Data can be a powerful tool for change. Tracking the right metrics in the right context can help us gain a deeper understanding of the communities we serve, so we can make a lasting impact.” Sparkwise

Here are my top 10 reasons why you should set up a Sparkwise dashboard:

1. Customisation and branding. Within certain limitations, you have an amazing amount of control over how your dashboard looks. You can add your own logos, links and images and choose the style and colours of the stats.

2. Highlighting your top statistics. Sparkwise allows you to draw attention to the stats you are most pleased about by positioning them more prominently on the dashboard. It is a great way to show stakeholders or managers your achievements.

3. Drawing attention to areas that need extra work. Just as it is easy to highlight your strengths, it can clearly and simply show you where you need to strategise more effectively.

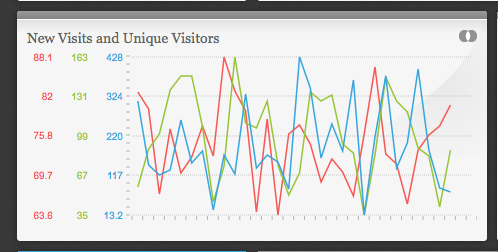
4. Comparisons and trends. Sparkwise allows you to group the metric widgets and create visual comparisons between them. For example, the image below shows Research to Action new visits, unique visits and the average time spent on the site. This enables you to see if there are specific peaks and troughs in certain areas and whether particular patterns emerge.


5. Constantly updating. Stats quickly become outdated when being downloaded. Sparkwise is set up through a number of feeds, which automatically refresh and can be set to display different time scales, so you never have to worry about your data being out of date.

6. Colourful and visually compelling. Reporting back to a client or stakeholder with a list of numbers in a spreadsheet, although factually accurate, is not exciting or gripping. This dashboard allows you to present the facts, but in a way that’s easy to decipher and visually stimulating.

7. Public or private.  Your Sparkwise dashboard, once published, can either remain an internal analysis tool, shared with a password protection, or open data, shareable publically through social media. This kind of statistical transparency, open data and external outreach for programmes and campaigns has become increasingly scrutinised since the internet has opened up new data sharing possibilities.

8. Simplicity.  A Sparkwise dashboard is so easy to set up – all you need is administrative access to the platforms you want to record statistics for.

9. Storytelling. You can use images, video, podcasts and text to tell a compelling story with your research, ideas or campaigns.

10. Mixed media and bespoke channels. Although the widgets for the live feeds are limited to certain platforms, you can upload and visualise spreadsheet data for any other bespoke platforms you want represented. For example, statistics on Slideshare or website PDF downloads. These would have to be updated manually, but it is great to know they can be included in reports for management or team meetings.

More reading on Sparkwise:

How A Web App Can Help Nonprofits Tell Better Stories And Raise Cash by Jeremy Lehrer

Related posts

What role for research when ordinary life is put on hold? - 29/11/2024
Africa’s use of evidence: challenges and opportunities - 02/09/2024
Nothing about us without us - 23/08/2024

Get 'New Post' e-alerts and follow R2A

> > > > >

Contribute to R2A:
We welcome blogposts, news about jobs, events or funding, and recommendations for great resources about development communications and research uptake.

Topics: social-media, sparkwise, tracking online data, visualising data

Betty Paton

Betty Paton is Research to Action's Communication Coordinator. She firmly believes that social media is a powerful tool in the communication of development research and is committed to embracing and understanding new, emerging and appropriate techniques for communicating development. She has a degree in Film Studies from the Combined Universities of Cornwall and an MA in Film and Cultural Management from Southampton University. She is also the Strategic Communication Manager at CommsConsult Ltd.

Contribute Write a blog post, post a job or event, recommend a resource

Partner with Us Are you an institution looking to increase your impact?

Most Recent Posts

  • Have we stopped caring about the climate?
  • What would a better international emergency aid system look like?
  • Does text messaging reach and engage young people?
  • Seeing the Future? Predictability in Research Impact
  • Knowledge brokers: what are they and what do they do?
🌀 Have we stopped caring about the climate?

Crisis fatigue. Shrinking attention spans. Endless global emergencies.

🌍 Climate change is slipping off the radar — even as the urgency grows.

In her latest blog, Inés Arangüena comnsiders new research from the Reuters Institute and explores how we can re-ignite public connection to the climate crisis — emotionally and politically.

📖 Read the full piece via 🔗 Link in bio

#ClimateChange #ClimateCrisis #CrisisFatigue #ScienceCommunication #ClimateAction #Sustainability #InesArangüena #ResearchToAction #ClimateAwareness #StayEngaged

🌍 Amidst a world in crisis, it's still possible — and powerful — to be part of building something better.

Want to help rethink how humanitarian aid works? 🌱 Join the global #HumanitarianRethink consultation and be part of shaping a more inclusive, effective, and far-reaching system.

🗣️ Add your voice.
🔗 Link in bio or visit:
researchtoaction.org/2025/05/what-would-a-better-international-emergency-aid-system-look-like

#RebuildingBetter #HumanitarianAid #R2ARecommends #GlobalVoices #AidReform #MakeChange #CrisisResponse #HumanityInAction

🌀 Can we predict research impact?
Not exactly — but we can think more clearly about what’s likely, what’s possible, and what’s out of our hands.

This week on @researchtoaction, we’re recommending a thoughtful resource:
📄 “Seeing the Future: Predictability in Research Impact”
🔗 Link in bio

A useful read for researchers, funders & knowledge brokers thinking about how research makes a difference in the real world.

#ResearchImpact #KnowledgeMobilisation #EvidenceUse #ImpactPlanning #ResearchEngagement #R2ARecommends #LinkInBio

#ResearchImpact #KnowledgeMobilisation #EvidenceUse #ImpactPlanning #ResearchEngagement #R2ARecommends


About Us

Research To Action (R2A) is a learning platform for anyone interested in maximising the impact of research and capturing evidence of impact.

The site publishes practical resources on a range of topics including research uptake, communications, policy influence and monitoring and evaluation. It captures the experiences of practitioners and researchers working on these topics and facilitates conversations between this global community through a range of social media platforms.

R2A is produced by a small editorial team, led by CommsConsult. We welcome suggestions for and contributions to the site.

  • Home
  • About Us
  • Cookies
  • Contribute

Subscribe to our newsletter!

Our contributors

  • Paula Fray
  • Shubha Jayaram
  • Sue Martin
  • Maria Balarin
  • James Harvey
  • Emily Hayter
  • Susan Koshy
  • Ronald Munatsi
  • Ajoy Datta

Browse all authors

Friends and partners

  • AuthorAid
  • Global Development Network (GDN)
  • INASP
  • Institute of Development Studies (IDS)
  • International Initiative for Impact Evaluation (3ie)
  • ODI RAPID
  • On Think Tanks
  • Politics & Ideas
  • Research for Development (R4D)
  • Research Impact

Copyright © 2025 Research to Action. All rights reserved. Log in